Information
PackSciences
Administrator
- Permalink: User Link
- Registered On: 19 Aug 2016
- Forum Posts: 5
- Last Forum Activity: 0000-00-00 00:00:00
- Imageboard Posts: 8
User Favorites
Pokémon

Episode

Character

Latest Forum Posts
09 Dec 2021 12:04 PM
PackSciences
Administrator
Joined: 19 Aug 2016
Posts: 5
Posts: 5
A note about the implementation in Python of the code, when N/m is big, the numerical algorithm may oscillate to give a probability above 1. This is quite expected when summing small quantities that are products of other small quantities. The filter chosen was : if N>1000, raise an Error; if sum>1 and N>100 : set the sum to one; if sum>1 and N. The algorithm can be found here.
Last edited 09 Dec 2021 12:06 PM by PackSciences
09 Dec 2021 12:04 PM
PackSciences
Administrator
Joined: 19 Aug 2016
Posts: 5
Posts: 5
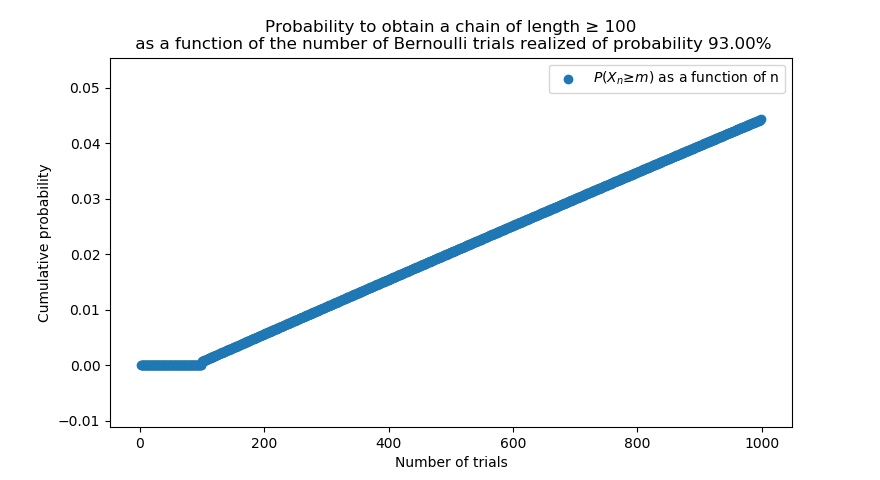
Then, you might notice that on the chart in which we would look for 100 Chain Number, the probability is quite low, we can expand the chart:
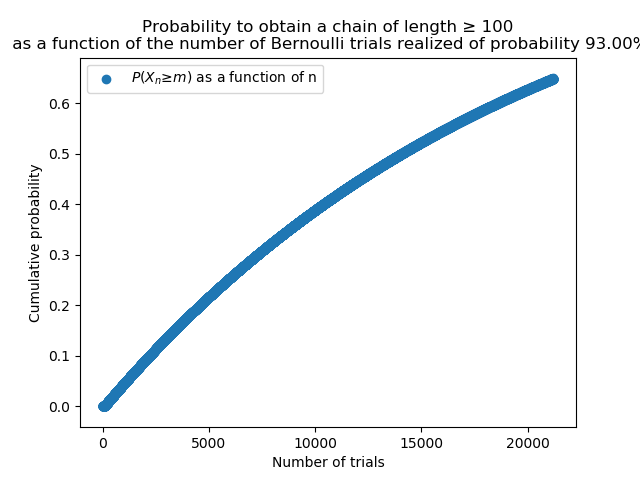
One can note that with 20000 trials, we barely get 60% chance of reaching 100 Chain Number (20 000 trials * 30 seconds = 7 days in a row non-stop).
One can note that with 20000 trials, we barely get 60% chance of reaching 100 Chain Number (20 000 trials * 30 seconds = 7 days in a row non-stop).
09 Dec 2021 12:03 PM
PackSciences
Administrator
Joined: 19 Aug 2016
Posts: 5
Posts: 5
These charts should be read as follows: "Oh, I want to play a certain amount of time today, which would be equivalent to X amount of Poké Radar rolls", then look up X on the horizontal axis and at the odd that you will reach a chain length m (40 or 100) in that amount of rolls.
09 Dec 2021 12:03 PM
PackSciences
Administrator
Joined: 19 Aug 2016
Posts: 5
Posts: 5
After implementing the algorithm in Python, one can plot different charts for optimal methods for m = 40 (shinyhunting) p=93%, m = 100 p=93%. One can also plot the probability for different values of p, but the shinyhunter pick the best methods (note: the change from 93% to 83% is huge since it is exponentially lowered, 10% chance for 1000 Poké Radar rolls with m=40 p=83%).
The results are detailed in the charts below:
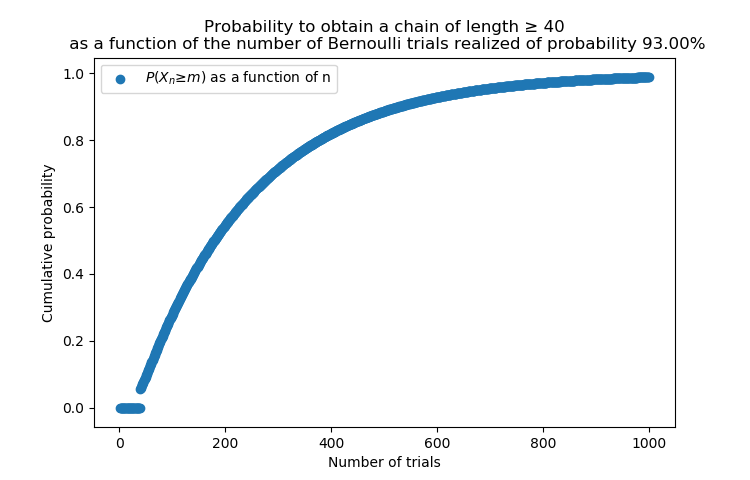
The results are detailed in the charts below:
09 Dec 2021 10:31 AM
PackSciences
Administrator
Joined: 19 Aug 2016
Posts: 5
Posts: 5
The goal of this thread is to calculate the probability of getting to a certain chain number in Brilliant Diamond and Shining Pearl without breaking it at a fixed amount of trials.
Poké Radar is a Key Item in Pokémon Brilliant Diamond and Shining Pearl that is used to locate special Pokémons and has a mechanism of chaining.
This mechanism of chaining is interesting as it can give more shinyness chances or guaranteed Max IVs depending on the length of the chain of encountered Pokémon.
Here is a chart of those two effects depending on the chain number found by dataminers.
However, the chain has a chance to break in the sense depending on how the battle of the Pokéradar is ended and the distance from the place where the radar was started and the grass tile that is moving (the calculation for the distance is the max between the distance in the horizontal axis and the distance in the vertical axis).
Therefore, we want to have the longest chain depending on our goal (40 for shinies and 100 for Max IVs). We want to calculate the odds of breaking the gain cumulated to reach a certain amount of chain. The model used is a Bernoulli trial model with a probability p=93% of success (implying we catch the Pokémon at the end of the battle, but the calculation can be redone easily). The probability to reach chain m with a probability p is: P(X=m) = p^m (which means you multiply the event of getting another radar roll, then another radar roll, and so on ... these events are independent so it is just the product of p, but m-times because of m events). This calculation can be found on several other websites. To give a numerical estimate, 0.93^40=0.055=5.5% which is quite low. Once the chain is maxed out, the shinyhunter can just restart the radar until a shiny patch appears which leads to getting a shiny Pokémon with an odd of 1 over 99.
Now, the problem can be expressed differently to the player's perspective that does not really care about the odds of breaking the chain but rather about the time invested. Instead of time, we will focus on the number of Poké radar encounters or more mathematically the number of Bernoulli trials and how do they relate to the global shinyhunting method. For shinyhunting, we would like to know what is the probability to get a chain of 40 or more given a certain amount of trials performed.
Fortunately, there are models to predict such quantities and can be derived from the generating functions of the Bernoulli trials.
Here is the frightening (not that scary to be frank) equation to implement in an algorithm, that is the analytical solution to our problem:
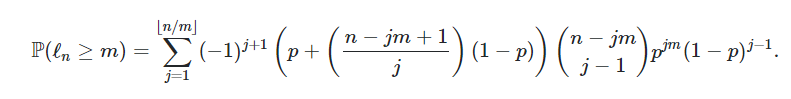
with:
- l_n, the variable length of the longest consecutive chain of Bernoulli trials at the n-th trial,
- m, the number of trials we are looking for (for example 40),
- p, the probability of the Bernoulli trials (the Pokéradar does or does not trigger after the battle) (p=93% if you catch the Pokémon),
- j, the summation variable.
Poké Radar is a Key Item in Pokémon Brilliant Diamond and Shining Pearl that is used to locate special Pokémons and has a mechanism of chaining.
This mechanism of chaining is interesting as it can give more shinyness chances or guaranteed Max IVs depending on the length of the chain of encountered Pokémon.
Here is a chart of those two effects depending on the chain number found by dataminers.
However, the chain has a chance to break in the sense depending on how the battle of the Pokéradar is ended and the distance from the place where the radar was started and the grass tile that is moving (the calculation for the distance is the max between the distance in the horizontal axis and the distance in the vertical axis).
Therefore, we want to have the longest chain depending on our goal (40 for shinies and 100 for Max IVs). We want to calculate the odds of breaking the gain cumulated to reach a certain amount of chain. The model used is a Bernoulli trial model with a probability p=93% of success (implying we catch the Pokémon at the end of the battle, but the calculation can be redone easily). The probability to reach chain m with a probability p is: P(X=m) = p^m (which means you multiply the event of getting another radar roll, then another radar roll, and so on ... these events are independent so it is just the product of p, but m-times because of m events). This calculation can be found on several other websites. To give a numerical estimate, 0.93^40=0.055=5.5% which is quite low. Once the chain is maxed out, the shinyhunter can just restart the radar until a shiny patch appears which leads to getting a shiny Pokémon with an odd of 1 over 99.
Now, the problem can be expressed differently to the player's perspective that does not really care about the odds of breaking the chain but rather about the time invested. Instead of time, we will focus on the number of Poké radar encounters or more mathematically the number of Bernoulli trials and how do they relate to the global shinyhunting method. For shinyhunting, we would like to know what is the probability to get a chain of 40 or more given a certain amount of trials performed.
Fortunately, there are models to predict such quantities and can be derived from the generating functions of the Bernoulli trials.
Here is the frightening (not that scary to be frank) equation to implement in an algorithm, that is the analytical solution to our problem:
with:
- l_n, the variable length of the longest consecutive chain of Bernoulli trials at the n-th trial,
- m, the number of trials we are looking for (for example 40),
- p, the probability of the Bernoulli trials (the Pokéradar does or does not trigger after the battle) (p=93% if you catch the Pokémon),
- j, the summation variable.
Last edited 09 Dec 2021 12:06 PM by PackSciences
Latest Imageboard Posts
File:
16390857810032.png
(640px x 480px -
34.21 KiB)

File:
16390846130078.PNG
(791px x 99px -
9.26 KiB)

Posted by: PackSciences on 09 Dec 2021 11:16:53 (No. 38851)
Source: https://math.stackexchange.com/questions/59738/probability-for-the-length-of-the-longest-run-in-n-bernoulli-trials
File:
16390839220073.png
(880px x 480px -
37.85 KiB)

File:
16390838300039.png
(750px x 480px -
35.63 KiB)

File:
16390821380058.PNG
(398px x 182px -
3.57 KiB)

Posted by: PackSciences on 09 Dec 2021 10:35:38 (No. 38848)
Source: https://twitter.com/Sibuna_Switch/status/1467056077384654849/photo/1